
The Compass - July 2026
|
||||
|
Every quarter tests a few assumptions nobody had gotten around to questioning. This one is testing several at once. Banks assumed deposit costs, not asset composition, would decide who wins on margin this year, and the data says otherwise. C&I growth just posted its best quarter in years, and the honest answer for why is still being determined. Two rating agencies quietly rewrote how they look at CLO collateral within days of each other. A bankruptcy court reminded a room full of sophisticated lenders that loan documents mean what they say. And a wave of new bank charters is about to test an assumption most banks never had to defend before: that deposit relationships are sticky. The Caird Team
|
||||
|
||||
|
By the Numbers
|
||||
|
Market Signals
Sources: Syndicated Loans / TLB default rate and distress ratio, PitchBook LCD. CLOs / Securities, Fitch Ratings and Moody's Investors Service methodology publications, effective June 1 and June 5, 2026, respectively. Morgan Stanley research (Private Credit default-rate estimate).
|
||||
|
Three Things We Are Talking About
|
||||
|
What We Are Hearing From Our Clients
“How many producers does it actually take to generate a dollar of loans? Is that ratio moving the wrong way?”
This came up directly at the TBA CFO Conference, and it's the sharper version of a question every bank is asking. Gross origination activity is strong across most of the regional banks we talk to, consistent with the 12.7% aggregate C&I growth. The harder problem sits on the other side of the ledger. Early payoffs, line paydowns, and refinancings are running high enough that replacing the runoff, not generating new volume, is the real constraint on net growth. A bank adding producers to chase gross originations without solving the net-growth problem is buying activity, not efficiency.
“We were finally seeing our unrealized losses unwind. This rate move undid it. What are our options for taking AOCI volatility off the table?”
Unrealized losses on investment securities are back up, $325.1 billion industry-wide in Q1, and the July back-up in rates erased most of the improvement the spring brought. The real options are narrower than clients want them to be. Selling now crystallizes a loss but frees up the reinvestment at materially higher yields. Holding keeps the loss on paper but leaves the book exposed to the next move. Reclassifying from available-for-sale to held-to-maturity removes future swings from AOCI without removing the embedded loss, and the Basel III Endgame reproposal would extend AOCI capital treatment down to any bank over $100 billion in assets, a detail that matters more to some institutions than others. The lower-friction option sits at the margin: directing new purchases into floating-rate CLO AAAs instead of back into fixed-rate agency RMBS, a shift that avoids adding to the interest rate exposure already embedded in the book. That doesn't fix the existing book, but it stops making the problem bigger.
Investing in CLO tranches involves credit, structural and liquidity risks and is not suitable for all investors. Caird may hold positions in CLO securities or related instruments and may receive fees that create conflicts of interest.
“We're seeing softness in consumer-facing sectors. Does that bleed into our corporate book and slow our lending?”
The consumer data is genuinely split rather than uniformly weak. Higher-income households are still spending, and University of Michigan sentiment just posted its second straight monthly gain. Lower-income households are under real and building strain. That split matters more than the headline number for a C&I book. Weakness transmits to corporate credit through companies selling to the strained cohort specifically, not through an entire sector. The names worth watching are consumer-facing borrowers with customer concentration in that lower-income segment, not every borrower tagged consumer discretionary.
|
||||
|
Chart of the Month
Unrealized losses on bank securities portfolios peaked at $690 billion in Q3 2022, then decreased to a $306 billion low in Q4 2025, and ticked back up to $325 billion in Q1 2026, the most recent quarter the FDIC has reported. The 10-year Treasury yield explains most of that path. It fell through most of 2024 and 2025, and the securities book recovered alongside it. Since Q1 2026 it has backed up again, from 4.30% to 4.55% as of July 17, the highest level since the end of 2024. The next Quarterly Banking Profile isn't out yet. This chart is what it will likely show.
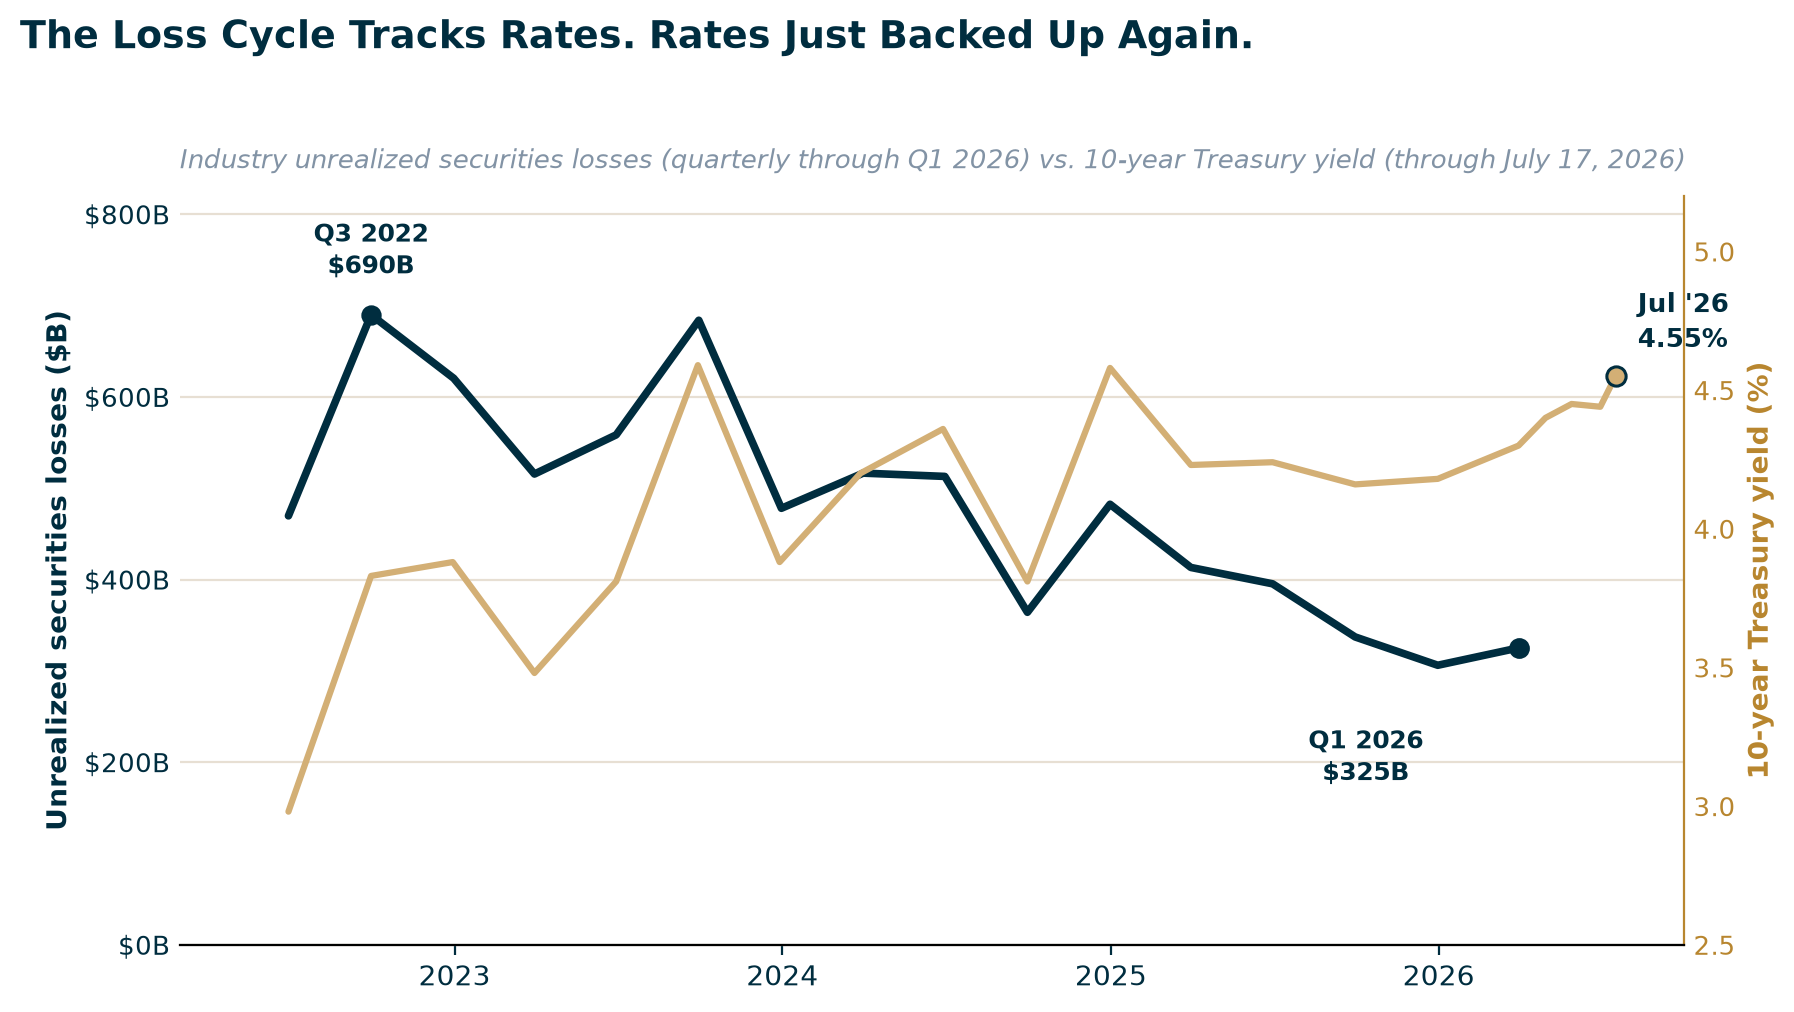
Sources: FDIC Quarterly Banking Profile releases, Q2 2022 through Q1 2026 (Q4 2023, Q3 2024, and Q4 2025 derived from reported dollar or percent change versus the adjacent verified quarter). 10-year Treasury yield: FRED series DGS10, quarter-end close, extended through July 17, 2026.
|
||||
|
The Caird Perspective
New Charters Are Testing How Sticky Deposits Really Are
The OCC received 14 de novo charter applications in 2025, nearly matching the prior four years combined, and is on pace for roughly 25 in 2026. Most are national trust charters, which permit custody and tokenization but not deposit-taking or lending. A few go further. Circle won its charter July 8, Sony Bank followed two days later, and Mercury Technologies received a broader charter in April that lets it build Zelle integration, lending products, and its own payments infrastructure, a more direct run at the deposit relationship than a trust charter alone. A second, older charter pathway is moving just as fast, and it can take deposits directly, no trust wrapper required. The FDIC has conditionally approved four industrial loan company charters since January: Ford Credit Bank, GM Financial Bank, Edward Jones Bank, and Stellantis Bank, with Nissan's application pending since June 2025. An ILC charter lets an automaker's captive finance arm or a brokerage's cash-management business hold deposits and lend against them directly, a more direct run at the relationship than anything crypto-adjacent has managed so far. The charters are not the whole story. What sits behind them matters more. USDC circulation is up 19% this year to $73.2 billion despite falling rates, and the stablecoin market overall has grown to roughly $310 billion. Estimates of what that could mean for bank deposits vary widely. Standard Chartered has put a figure as high as $500 billion by the end of 2028, while the Fed's own research spans $65 billion to $1.26 trillion in potential lending impact, depending on adoption and where issuers hold reserves. That range is itself worth noting: nobody has landed on a precise number yet, but the direction of the risk is not really in question. The competition is not hypothetical either. X Money launched in beta in late June offering 6% APY on deposits held through a partner bank, an explicit teaser rate that is not sustainable at current rates but is doing exactly what a teaser rate is designed to do. It is one data point, not a trend, but it is the clearest sign yet of how aggressively new entrants are willing to price for share. Deposit relationships have historically relied, to some extent, on friction, the small cost of moving money that keeps a balance sitting where it is. Real-time settlement rails, a federally chartered stablecoin issuer, and a captive finance arm that can now hold deposits directly are all, in their own way, an attempt at removing that friction. It may be worth adding this scenario to the usual rate-driven funding stress tests, as a distinct variable rather than a replacement for them.
Sources: OCC charter and licensing decisions (2025-2026); CNBC and IBTimes, Circle and Sony Bank OCC approvals, July 2026; Mercury Technologies OCC conditional approval, April 27, 2026; FDIC ILC charter approvals via Banking Dive (Ford Credit Bank and GM Financial Bank, January 22, 2026; Edward Jones Bank; Stellantis Bank); Standard Chartered research; Federal Reserve FEDS Notes, December 2025; X Money product launch coverage, June 2026.
|
||||
|
||||
|
Caird Investment Partners, LLC is a SEC registered investment adviser. This material is provided for informational purposes, and it is not, and may not be relied on in any manner as, legal, tax or investment advice or as an offer to sell or a solicitation of an offer to buy an interest in any fund or investment vehicle managed by Caird Investment Partners, LLC (“Caird”). The information and data are as of the publication date unless otherwise noted. Past performance is not indicative of future results. Content obtained from third-party sources, although believed to be reliable, has not been independently verified as to its accuracy or completeness and cannot be guaranteed. Caird has no obligation to update, modify or amend the content of this post nor notify its readers in the event that any information, opinion, projection, forecast or estimate included, changes or subsequently becomes inaccurate.
|
